NOMAD Labels Interference
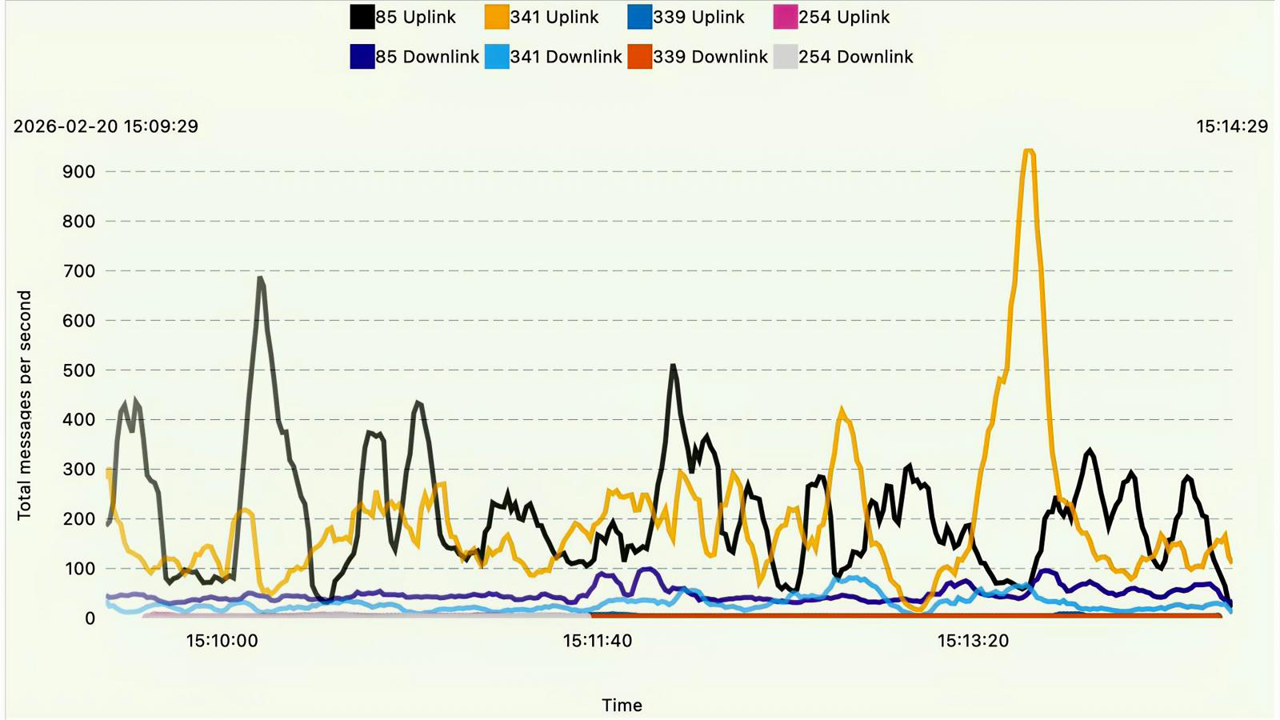
The graph below highlights NOMAD's passive RF monitoring capability to resolve and attribute co-channel interference to individual base stations using Physical Cell ID (PCI) labeling — no prior network configuration or operator input required.
The capture shown is from a 5G NR Band 5 deployment in Berkeley, CA. Over a ~5-minute observation window, NOMAD detected four concurrent gNodeBs transmitting on the same frequency band and independently tracked both uplink and downlink message rates for each. The time-series plot reveals significant PCI contention, with gNodeBs PCI 85 and PCI 341 exhibiting the highest message throughput and therefore representing the dominant interference sources in this RF environment.
This level of per-PCI visibility is critical for diagnosing issues such as pilot pollution, PCI confusion, and handover failures — scenarios where conventional drive test tools or network-side KPIs alone are insufficient to isolate the root cause. The dataset behind this example is representative of hundreds of similar interference events captured by NOMAD across production networks, demonstrating the tool's reliability and repeatability in complex multi-cell RF environments.
There is no need to guess which base station is interfering; NOMAD will indicate and label all observable base stations with their physical cell ID. The graph shows:
5G Band 5 in Berkeley, CA
Messages per second as observed by NOMAD
4 Base Stations at the same time in the same frequency
gNodeBs with physical cell ids 85 and 341 are dominant
Hundreds of examples observed like this in real networks